FORCE FIELD ASSESSMENT IN THE MOLECULAR SIMULATION OF INTERFACIAL TENSIONS OF SURFACTANTS - poster
Harry Cárdenas1, Siti Fatihah Salleh2, Sara Shahruddin2, and Erich A. Müller1
1Chemical Engineering Department, Imperial College London, UK.
2Specialty Chemicals Technology, PETRONAS Research Sdn Bhd, MALAYSIA
With advancement in algorithms and computational power, it is now possible to practically model systems that closely resemble those studied in the laboratory using atomistic molecular dynamics simulations. However, the impressive visual graphics and the detailed molecular insight obtained from the calculations distract from the fact that these representations and their quantitative predictions are only as good as the quality of the underlying force fields used to describe the intermolecular interactions. Hence, it is critical to identify the right intermolecular potential with the appropriate balance of accuracy, transferability and representability. We present here an example to demonstrate the impact of force field selection for surfactant performance assessment.
The systems under study herein include alkyl polyglucosides (APG) molecules; biocompatible and degradable surfactants formed by a sugar-based hydrophilic head, and a hydrocarbon-based hydrophobic tail. Two different interfacial environments are considered: water/air interface and water/oil interface, where the oil is phase is represented by n-decane molecules. Our initial simulations show that the pcff+ water model induces a physically unrealistic behaviour for the surfactants at the interface, particularly noticeable at the water-air interface (Figure 1) which are improved by employing an older model, (labelled here as pcff). The work discusses these issues in depth and served to highlight the general question of how much confidence we can/should have on the predictions of molecular dynamics simulations and the importance of testing the validity of the potentials against experimental results.
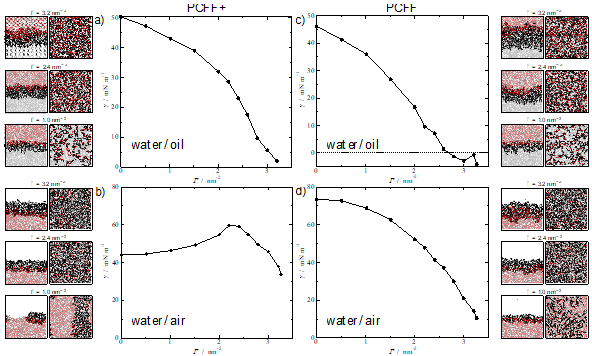
Figure 1. Interfacial tension at 298.15 K of: (top) APG12 at water/decane interface; (bottom) APG12 at water/air interface. The left figures correspond to the use of the pcff+ water model while those on the right with the older pcff water model. APG12 and n-decane molecules were modelled with pcff+ for all the systems. Snapshots for three different surface coverages values are added for each system, showing side and top view.